The PHS Data Portal is a cloud-based platform for hosting and sharing public to high-risk datasets.
Signing up for an Account
Signing up for a Data Portal account is simple: you go to ☞ https://phsdata.stanford.edu, click the Create account button and type either your institutional email address (e.g., you@your-university.edu) or sign in with a Google account. The PHS Data Portal supports authentication through over 2,500 academic institutions from around the world. If you have an alias Stanford email, please make sure to use your stem Stanford email.
Fill out the membership form, make sure the information is correct, and create the account. You can always update your profile information and login info in the Settings tab of your workspace.
Stanford "Data Protection" policies require that we collect and maintain profile information on all Stanford PHS data users. These requirements come from our regulators and data partners, and are intended to prevent abuse of protected and personal data. The information you provide is reviewed internally to ensure they comply with our legal agreement. If we need any further information, we’ll get in touch right away.
Linking ORCID
Open a web browser and go to ☞ https://orcid.org. Use the search box to find yourself. If you already know your login, then just log in. Please do not create a duplicate ORCID. The whole point of ORCID is a unique identifier to track research productivity.
Go to ☞ https://phsdata.stanford.edu and make sure you are logged in as well.
Click the home icon on the upper left corner on the portal page.
On your home page, select "Settings" from the menu on the left (bottom).
Click the "Link your ORCID" button located below your profile picture. The portal will automatically link your ORCID to the system.
Data Catalog UI
The screenshot below shows the user interface of the Dataset portal page.
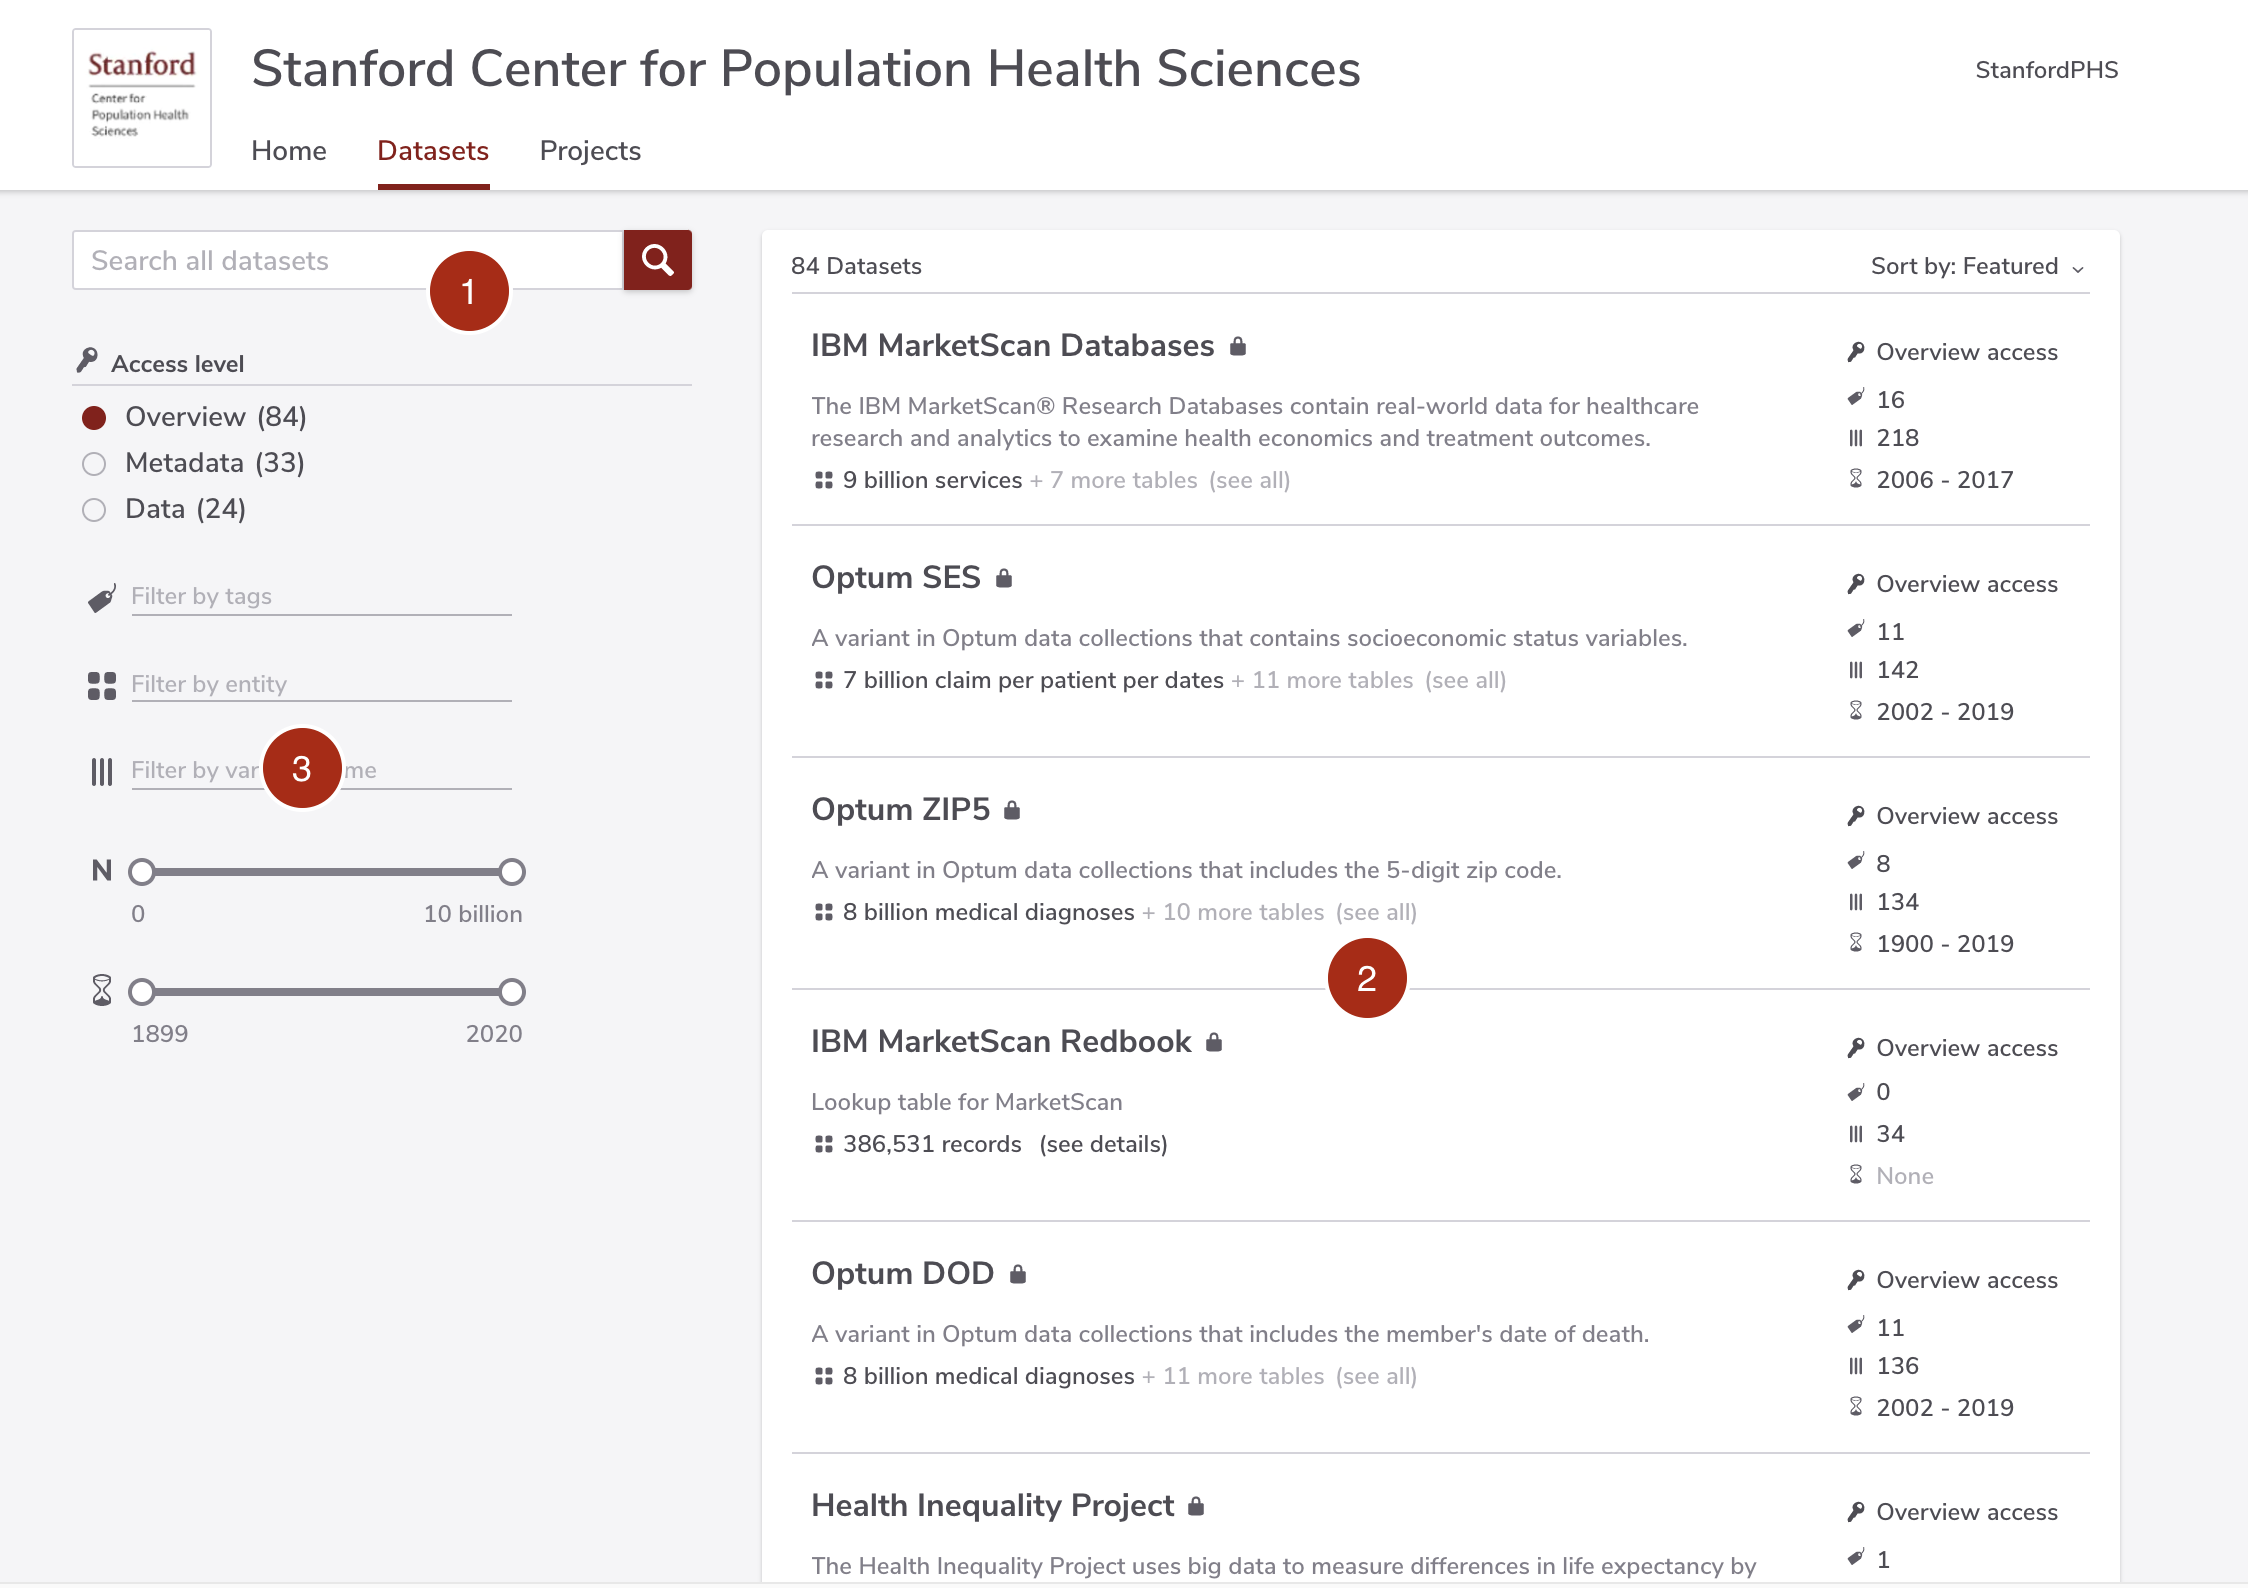
(1) Search field
Type search keywords here.
(2) Search result panel
Each section in the search result panel describes briefly the dataset, including its name, description, type and other attributes. The icon next to the dataset name is the dataset's type: A "lock" icon indicates a restricted dataset, and a "globe" icon indicates a public dataset.
The icons at the right hand side (from top to bottom) indicates: (a) the access level (Overview, Metadata and Data), (b) the number of tags, (c) the number of variables, and (d) the data temporal range. Moving the cursor over the value will reveal more detailed information.
(3) Search filters
The filters are self-explanatory
Workflow UI
The screenshot below shows the user interface of the Project page.
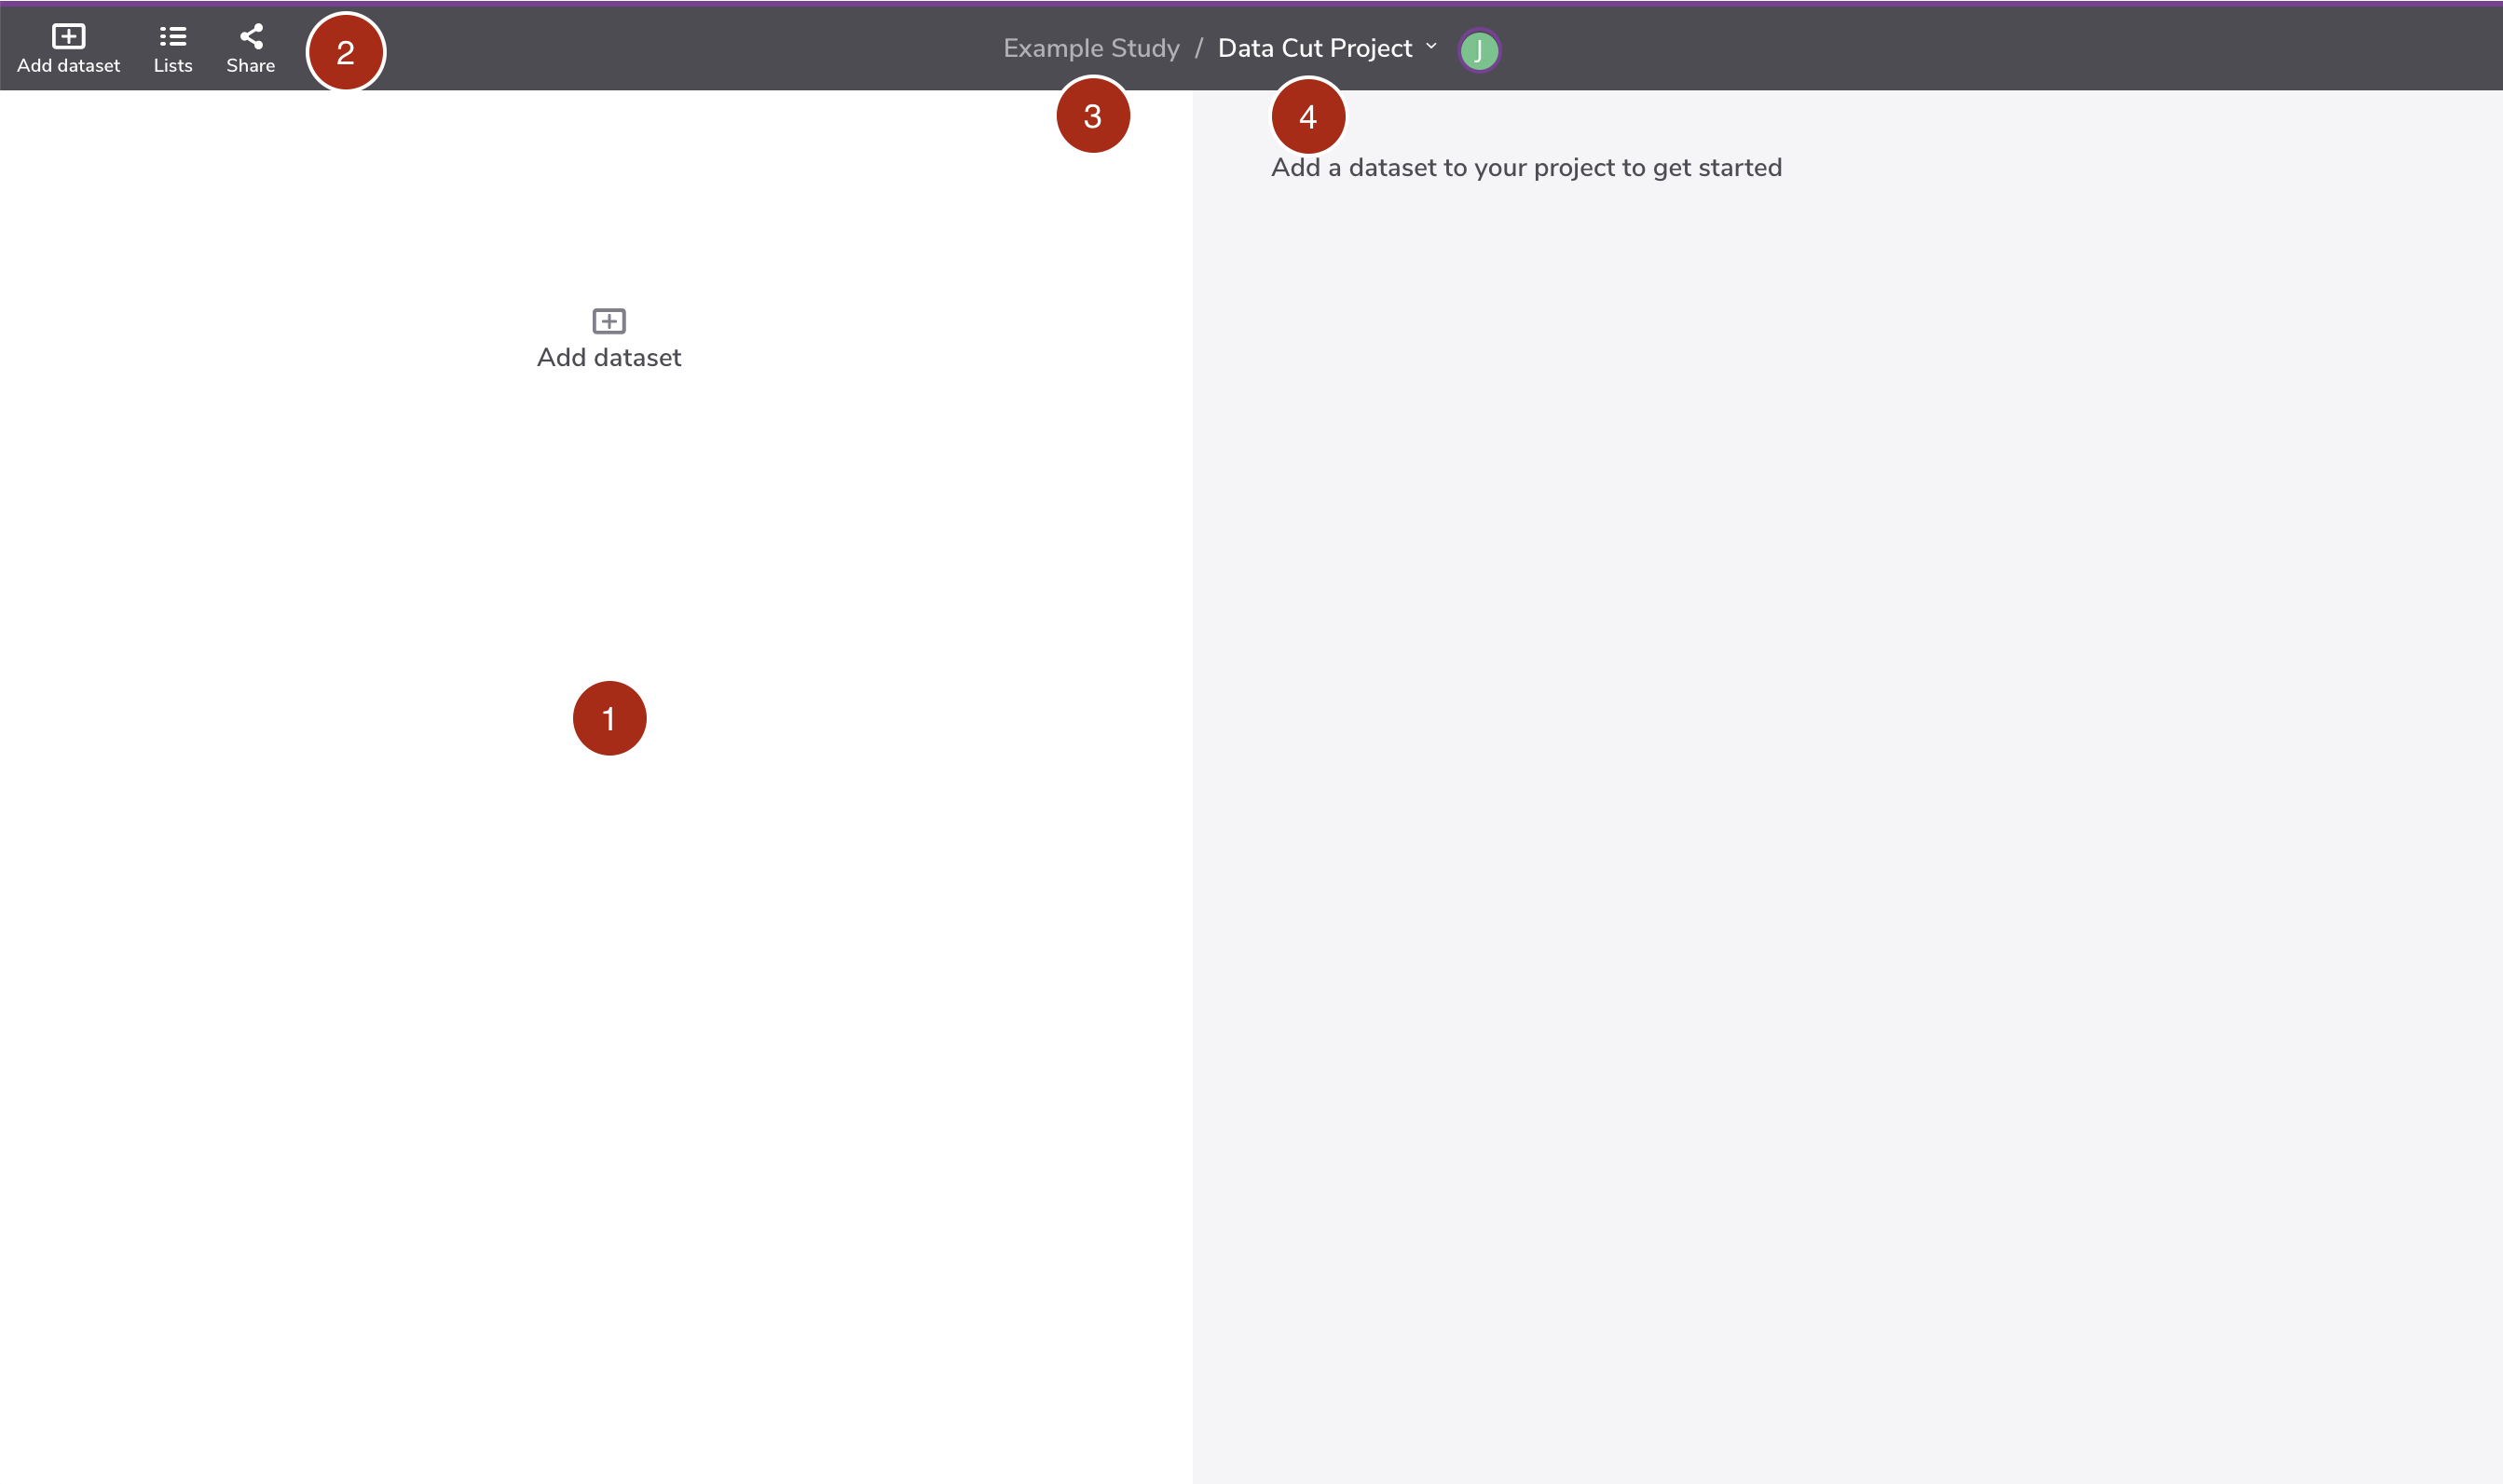
(1) Minimap
The Minimap displays the entire data cut flow.
(2) Workflow menu
The workflow menu consists of three commands (left to right): add a dataset into the workflow, manage value lists, and share the workflow with collaborators.
(3) Study name
Self-explanatory. Clicking the label will allow you to move the workflow to other study name.
(4) Workflow name
Self-explanatory. Move over the mouse cursor onto the name to access the workflow metadata
To learn more about the interface overview, please refer to the official documentation ☞ https://docs.redivis.com/reference/workflows
Table Node UI
The screenshot below shows the Table node editor.
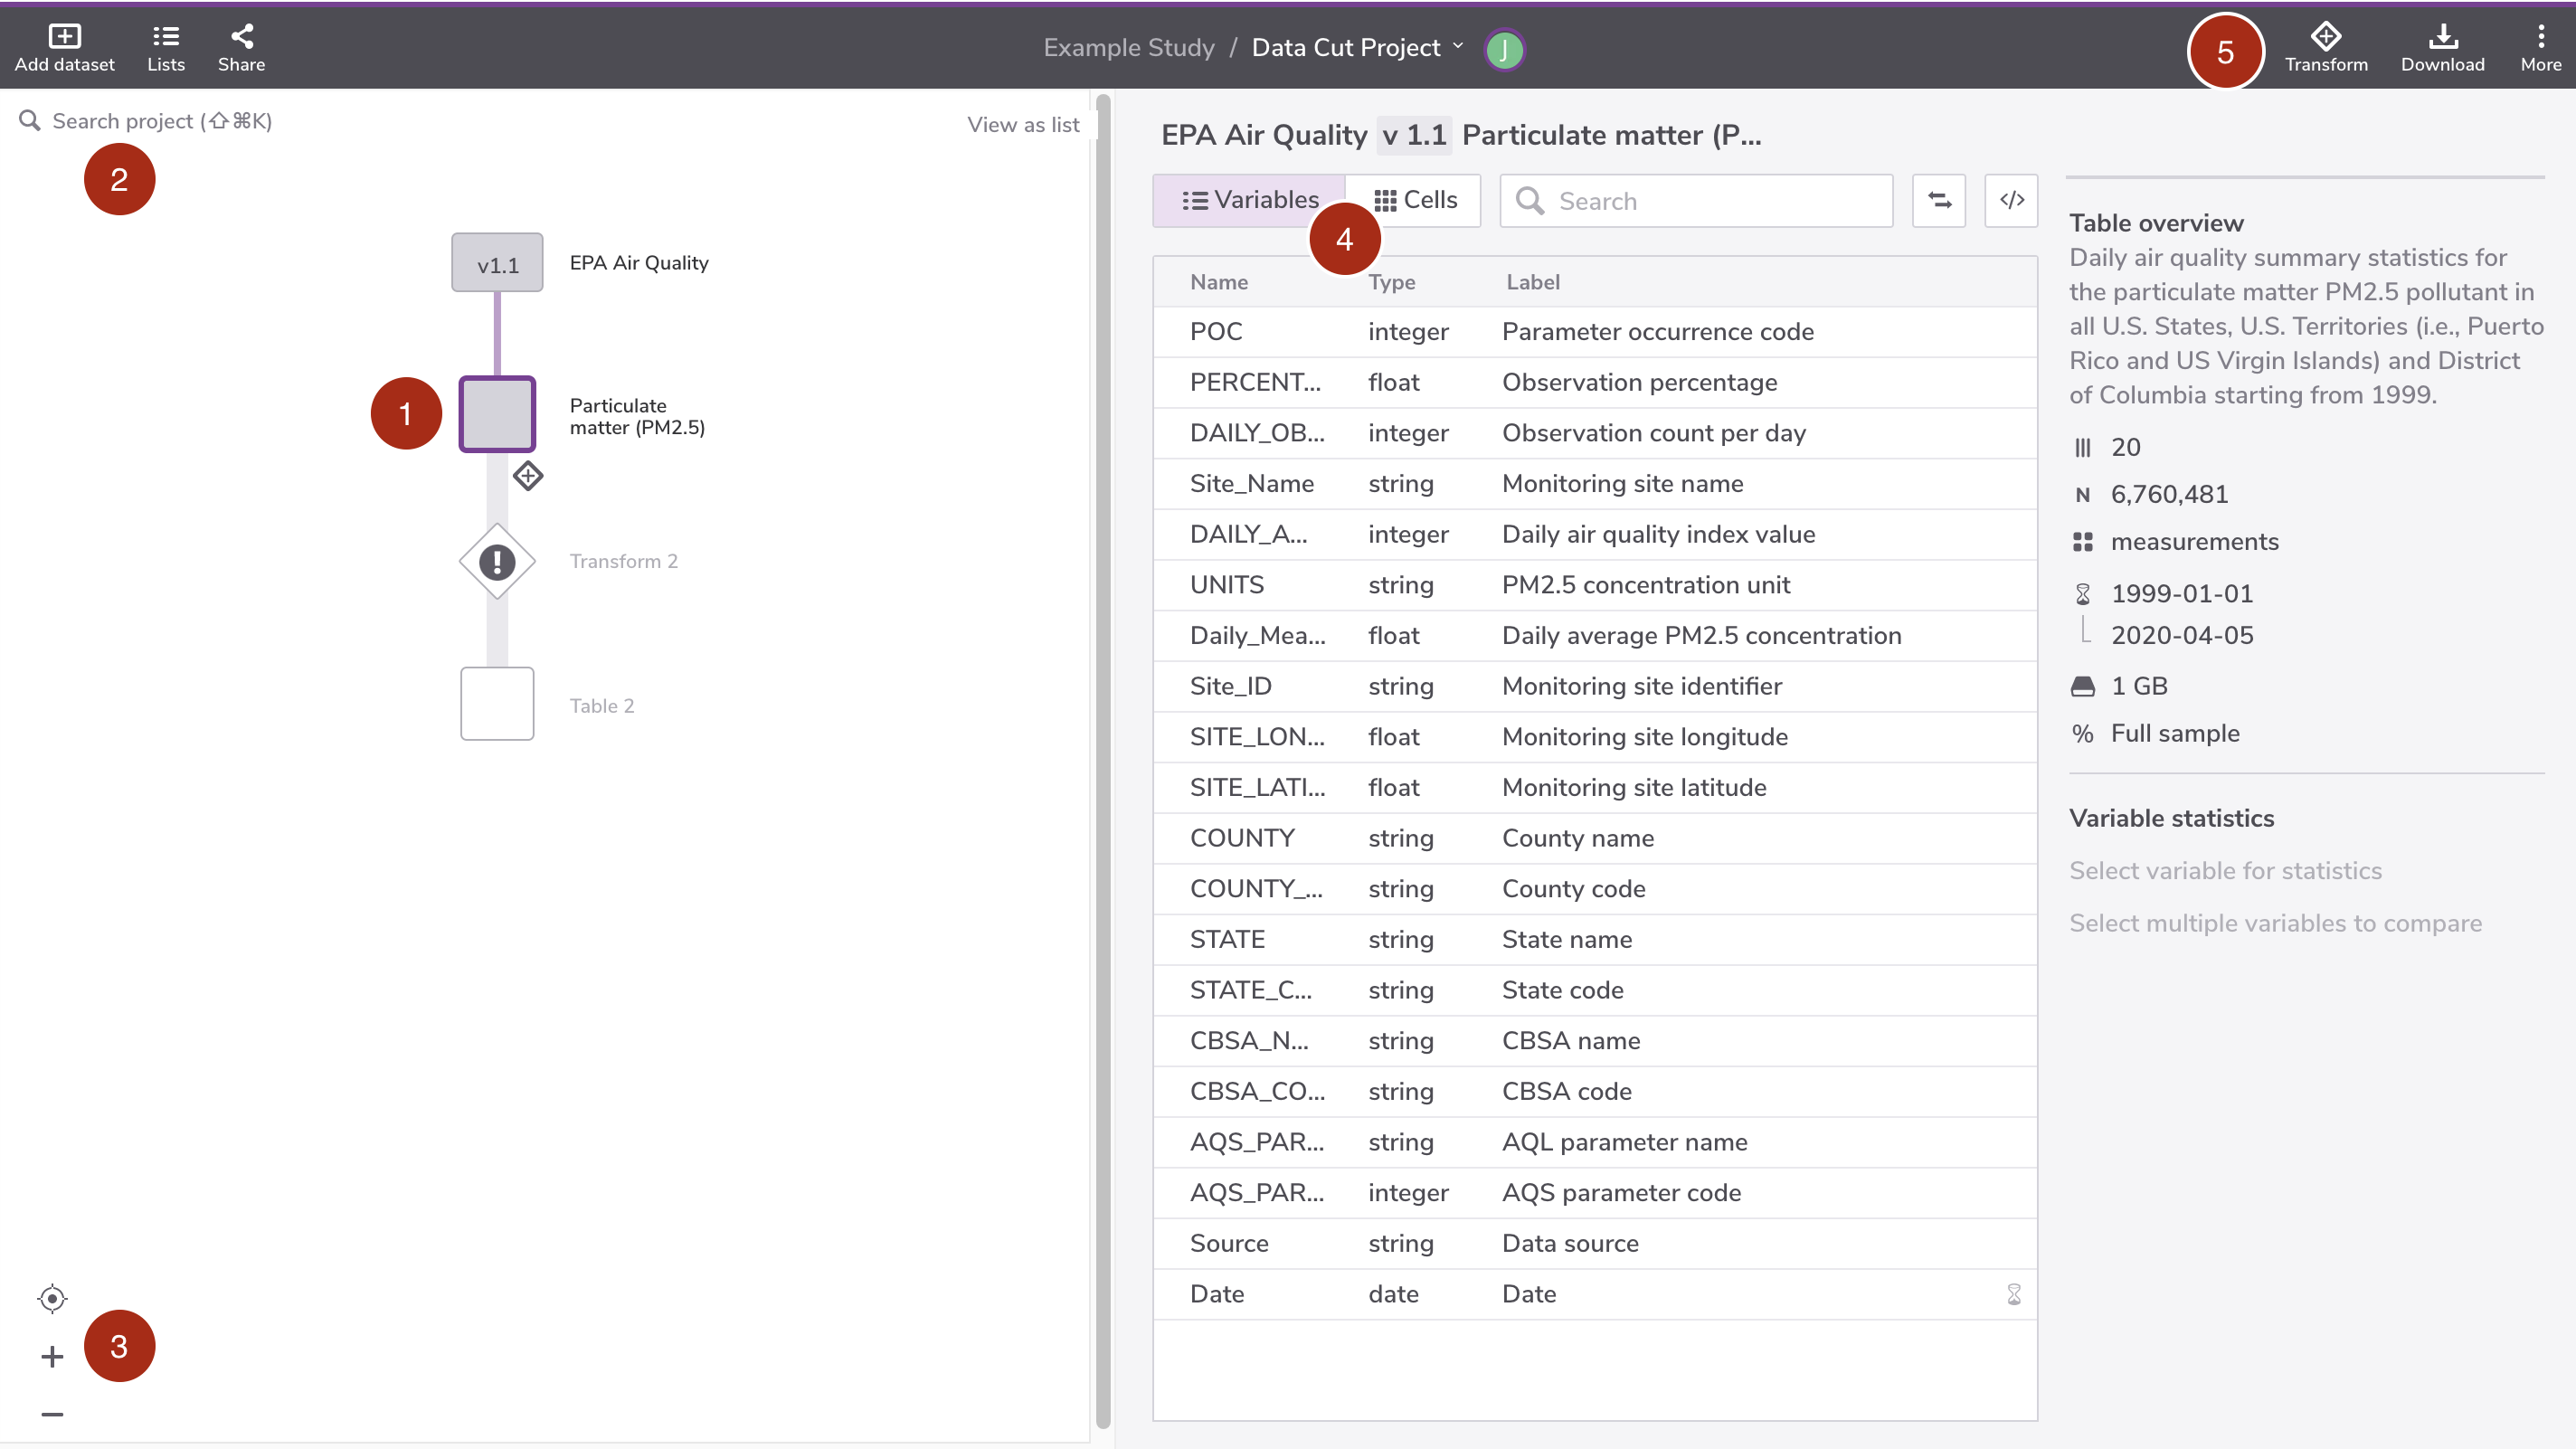
(1) Table node
The dataset node is depicted as a rectangular icon. The name of the dataset is displayed at the icon's right side and its version is printed inside the icon.
(2) Search project nodes
Self-explanatory
(3) View options
The view options include (top to bottom): best fit, zoom in, and zoom out.
(4) Table explorer
The table explorer has two options (left to right): show variables and show sample data
(5) Table menu
The table menu consists of three commands (left to right): add a new transformation, download the table data, and see more options. The "see more options" menu include other actions such as: rename the table, add description, view access, download, add copied transform and run all upstream nodes.
To learn more about the Dataset node, please refer to the official documentation ☞ https://docs.redivis.com/reference/workflows/workflow-concepts#tables
Transform Node UI
The screenshot below shows the Transform node editor.
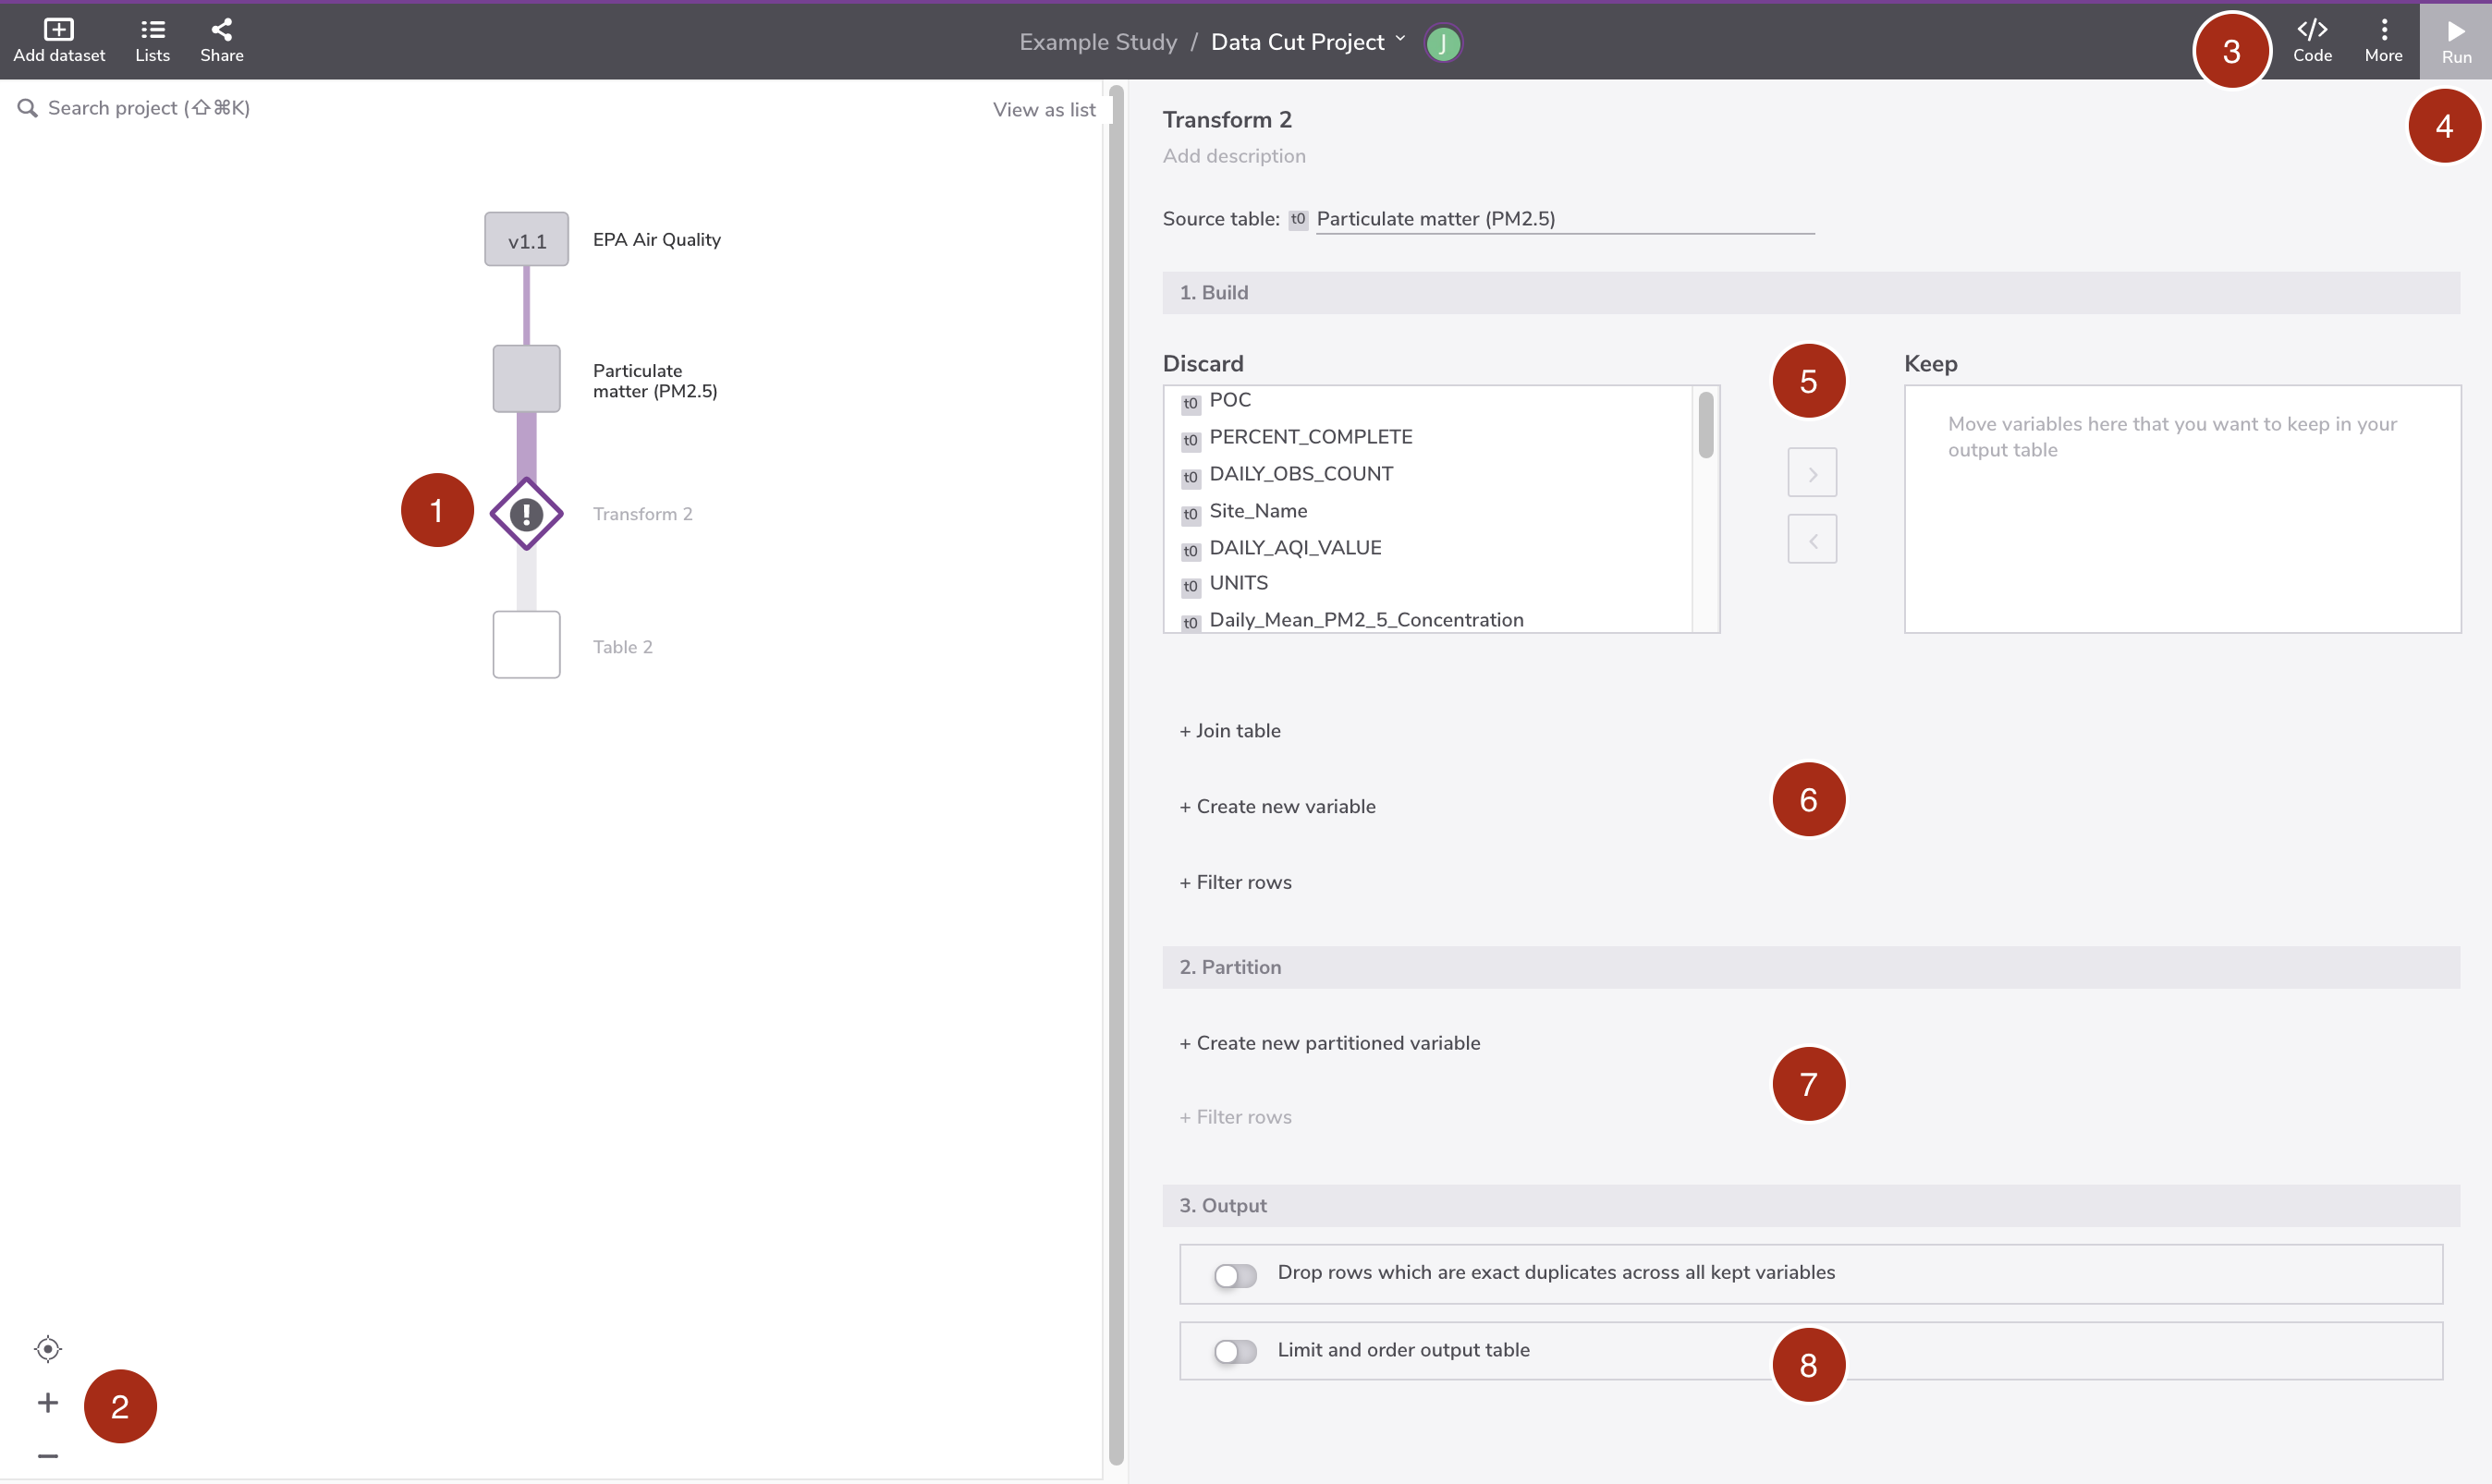
(1) Transform node
The transform node is depicted as a diamond icon. Users can name the transformation node and it will be displayed at the icon's right-hand side.
(2) View options
The view options include (top to bottom): best fit, zoom in, and zoom out.
(3) Data transform menu
The dataset menu consists of two commands (left to right): open the query code editor and see more options. The "see more options" menu include common actions, such as: view node metadata, add annotation, copy node, delete node, and so on.
(4) Run command
Execute the data transformation.
(5) Variable selector panel
The variables in the right box will be retained.
(6) Build operations panel
This panel gives you the option to: (a) join multiple tables, (b) create new variables, or (c) filter records .
(7) Partition operations panel
This panel gives you the option to: (a) create an aggregated variable based on grouping criteria__, and (b) filter records.
(8) Output options panel
This panel gives you the option to: (a) drop duplicates, (b) limit the output size from the output
To learn more about the Transformation nodes, please refer to the official documentation ☞ https://docs.redivis.com/reference/workflows/transforms